From the WSGR Database: Financing Trends for Full-Year 2014
For purposes of the statistics and
charts in this report, our database
includes venture financing
transactions in which Wilson
Sonsini Goodrich & Rosati
represented either the company or
one or more of the investors.
|
With a new year underway, we have an opportunity to look back at venture financings in 2014 to reflect on the most dynamic, vibrant period of venture investing since 1999. Importantly, the momentum and energy in the venture community suggests that, absent external events, activity will continue to be high in 2015.
As an introduction to our 2014 year-end issue of The Entrepreneurs Report, we offer a series of observations in light of the reports numbers that should be helpful to entrepreneurs and VCs alike, and we welcome the questions these conclusions evoke as we march ahead into the new year.
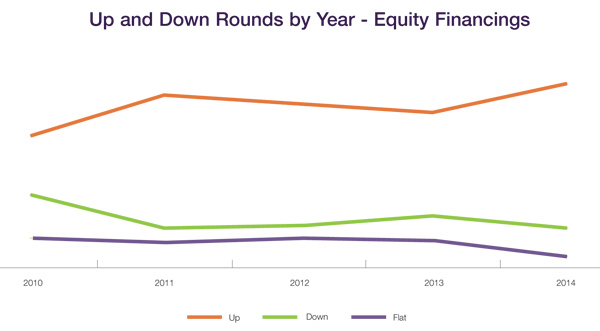
Up Rounds vs. Down Rounds
The healthier, larger percentage of up rounds reflects venture investors greater confidence in the quality of the companies raising funding.
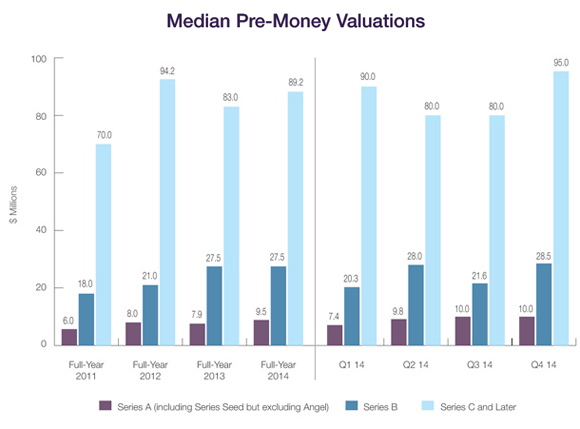
 Valuations Valuations
Valuations are higher. Our reports median valuation numbers for 2014 show an increase over 2013, which is consistent with trend reports and published news. For example, Dow Jones VentureSources report shows that the median valuation for all venture financings in 2014 was $40 million, up from $20 million in 2013.
Similarly, we saw a median valuation for Series C and later rounds of $89.2 million in 2014, compared with $83 million in 2013.
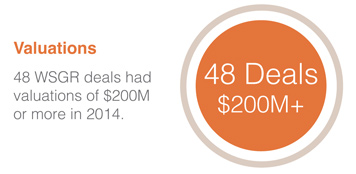
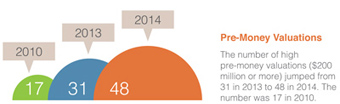
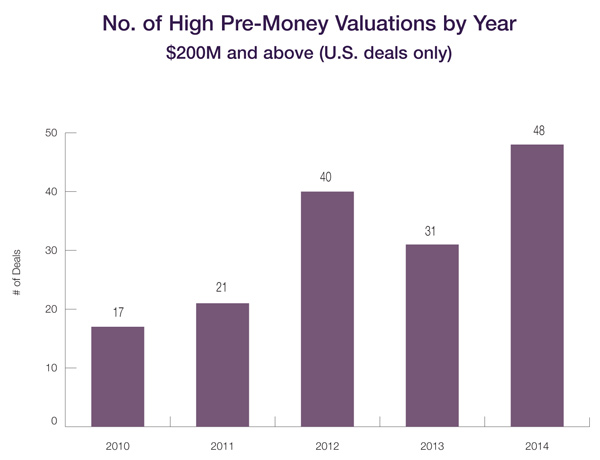
More financings went to companies with larger valuations. Our report shows a significant number of individual venture financings in which companies had pre-money valuations of $200 million or more.
Of course, the high valuations also closely track highs in the market for publicly traded companies, the ability to achieve positive liquidity events through both initial public offerings and acquisitions, and large amounts of money chasing a relatively small number of quality deals.
Amounts Raised
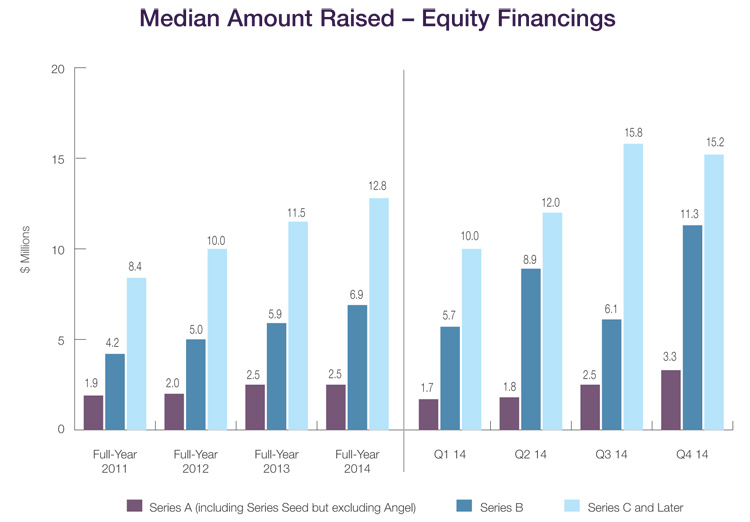
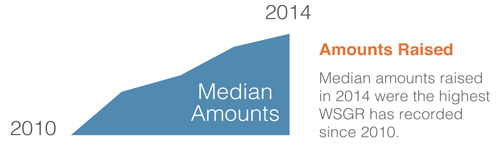 Median amounts raised in 2014 were the highest the firm has recorded since at least 2010.1 Median amounts raised in 2014 were the highest the firm has recorded since at least 2010.1
- The 2014 median amount raised in Series B deals was $6.9 million, the highest figure in the past four years.
- The 2014 median amount raised in Series C and later rounds was $12.8 million, substantially higher than 2013s median of $11.5 million.
While dollar amounts raised in 2014 increased significantly, based on our own data and data released by other sources, the overall number of venture financings has not increased. This may be a healthy sign that the large amount of money flooding into venture is aggregating in companies perceived to be of higher quality, and there remains a tight filter on new companies raising funds. In short, raising large amounts of money may be easier, but raising money may not be.
1WSGR altered its methodology in 2010 to more accurately reflect amounts raised in a quarter, rather than across the full funding cycle of a round. Consequently, it is difficult to compare prior periods.
|
Up and Down Rounds
2014 was a robust year for companies raising venture capital. Up rounds constituted 78% of all deals, the highest proportion in recent years. Only 17% of deals were down rounds, while 5% were flat rounds.
Valuations
Valuations were also strong across the board in 2014. A Q4 median of $95.0 million for Series C and later rounds helped raise the full-year median to $89.2 million, higher than the $83.0 million median in 2013 but slightly lower than 2012s $94.2 million. The median Q4 2014 valuation for Series B deals was $28.5 million—making Q4 the strongest quarter of 2014—and ensured that the full-year 2014 median for Series B deals matched the full-year 2013 median of $27.5 million. For Series A deals, the median valuation was $10.0 million, which matched Q3 2014 and brought the full-year median to $9.5 million—substantially more than 2013s median of $7.9 million.
Not only were valuations for most deals high by historical standards, but there were a significant number of individual venture financings in which companies had pre-money valuations of $200 million or more.
|
Amounts Raised
Median amounts raised in Q4 2014 were quite strong, which helped ensure that median amounts for the full year were the highest WSGR has recorded since at least 2010.2
The median Q4 2014 amount raised in Series C and later rounds was $15.2 million, nearly as high as in Q3, which helped raise the median for the full year to $12.8 million, substantially higher than 2013s median of $11.5 million. Amounts raised in Series B deals were remarkably large. Companies closing Series B deals raised a median of $11.3 million in Q4 2014 and $6.9 million for the full calendar year, the highest figure in the past four years. For Series A deals, the median amount raised in Q4 was $3.3 million, bringing the median for the full year to $2.5 million, which equaled the median recorded in 2013.
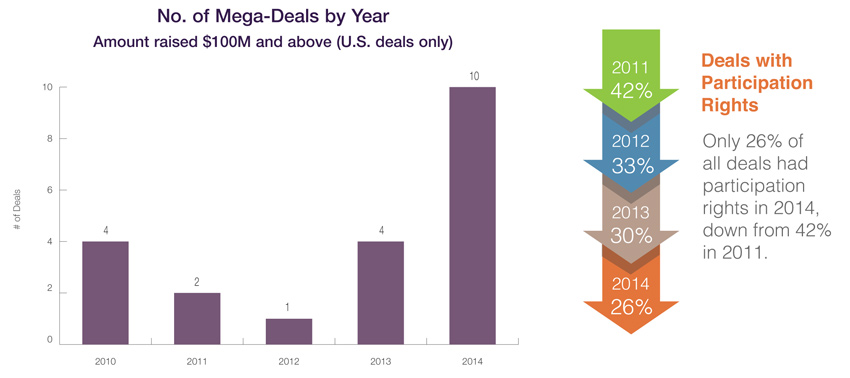
The number of very large individual deals also increased substantially compared to prior years. Specifically, there were 10 venture deals for U.S. companies that raised $100 million or more in 2014.
 |
|
2WSGR altered its methodology in 2010 to more accurately reflect amounts raised in a quarter, rather than across the full funding cycle of a round. Consequently, it is difficult to compare prior periods.
 Deal Terms Deal Terms
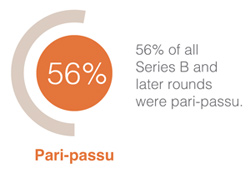
Liquidation preferences. In 2014, the majority of Series B and later rounds continued to be pari passu with earlier rounds (56% of all deals). The only exception to this was the small number of down rounds, where the percentage of deals with a senior liquidation preference climbed over 20 percentage points, from 47% to 68% of all deals.
 Participation. The use of non-participating preferred continued to increase, rising from 70% of all deals in 2013 to 74% in 2014 (and up even further from 58% in 2011). The use of non-participating preferred even increased in down-round deals, where the percentage rose from 48% in 2013 to 55% in 2014. Participation. The use of non-participating preferred continued to increase, rising from 70% of all deals in 2013 to 74% in 2014 (and up even further from 58% in 2011). The use of non-participating preferred even increased in down-round deals, where the percentage rose from 48% in 2013 to 55% in 2014.
Dividends. Non-cumulative dividends remained the most popular option, at 72% of all deals in 2014. There was a jump in the use of cumulative dividends in down rounds, from 13% of such deals in 2013 to 24% in 2014. However, given the relatively low number of down rounds in 2014, this jump did not affect the overall metrics significantly.
Anti-dilution. There was no meaningful change in the use of anti-dilution provisions in 2014 financings, as broad-based weighted average continued to be the most popular, at 92% of up rounds and 95% of down rounds.
Pay to Play. There was no significant change in the use of pay-to-play provisions between 2013 and 2014. In both years, such provisions were rare in up rounds and were used in only 15% of down rounds in 2013 and 16% of down rounds in 2014.
Private Company Financing Trends
(WSGR Deals)1
|
2011 |
2012 |
2013 |
2014 |
2011 |
2012 |
2013 |
2014 |
2011 |
2012 |
2013 |
2014 |
All Rounds2 |
All Rounds2 |
All Rounds2 |
All Rounds2 |
Up Rounds3 |
Up Rounds3 |
Up Rounds3 |
Up Rounds3 |
Down Rounds3 |
Down Rounds3 |
Down Rounds3 |
Down Rounds3 |
Liquidation Preferences - Series B and Later |
Senior |
47% |
37% |
41% |
40% |
34% |
30% |
38% |
32% |
79% |
56% |
47% |
68% |
Pari Passu with Other Preferred |
51% |
58% |
55% |
56% |
64% |
67% |
60% |
64% |
18% |
39% |
37% |
21% |
Complex |
1% |
2% |
3% |
2% |
1% |
2% |
2% |
2% |
3% |
0% |
11% |
5% |
Not Applicable |
1% |
3% |
1% |
3% |
1% |
1% |
0% |
2% |
0% |
5% |
5% |
5% |
Participating vs. Non-participating |
Participating - Cap |
16% |
14% |
18% |
12% |
17% |
13% |
20% |
14% |
22% |
17% |
23% |
13% |
Participating - No Cap |
26% |
19% |
12% |
14% |
24% |
20% |
10% |
11% |
46% |
41% |
30% |
32% |
Non-participating |
58% |
67% |
70% |
74% |
59% |
67% |
69% |
76% |
32% |
41% |
48% |
55% |
Dividends |
Yes, Cumulative |
11% |
9% |
12% |
13% |
11% |
10% |
12% |
11% |
19% |
12% |
13% |
24% |
Yes, Non-cumulative |
78% |
78% |
74% |
72% |
79% |
81% |
79% |
74% |
73% |
78% |
79% |
71% |
None |
11% |
13% |
14% |
15% |
10% |
9% |
9% |
15% |
8% |
10% |
8% |
5% |
Anti-dilution Provisions |
Weighted Average - Broad |
91% |
92% |
95% |
89% |
91% |
92% |
96% |
92% |
80% |
85% |
97% |
95% |
Weighted Average - Narrow |
4% |
3% |
3% |
9% |
7% |
3% |
3% |
6% |
6% |
5% |
0% |
5% |
Ratchet |
3% |
3% |
1% |
1% |
2% |
2% |
0% |
1% |
6% |
8% |
3% |
0% |
Other (Including Blend) |
3% |
3% |
1% |
1% |
1% |
3% |
1% |
1% |
9% |
3% |
0% |
0% |
Pay to Play - Series B and Later |
Applicable to This Financing |
6% |
5% |
5% |
4% |
1% |
1% |
1% |
1% |
20% |
23% |
15% |
16% |
Applicable to Future Financings |
6% |
3% |
1% |
0% |
4% |
3% |
1% |
0% |
11% |
3% |
0% |
0% |
None |
88% |
92% |
95% |
96% |
94% |
96% |
98% |
99% |
69% |
74% |
85% |
84% |
Redemption |
Investor Option |
22% |
22% |
19% |
17% |
25% |
23% |
20% |
22% |
32% |
35% |
33% |
24% |
Mandatory |
2% |
1% |
1% |
3% |
2% |
1% |
2% |
3% |
3% |
3% |
0% |
3% |
None |
77% |
77% |
80% |
80% |
73% |
76% |
78% |
75% |
65% |
63% |
67% |
74% |
| 1We based this analysis on deals having an initial closing in the period to ensure that the data clearly reflects current trends. Please note that the numbers do not always add up to 100% due to rounding. |
| 2Includes flat rounds and, unless otherwise indicated, Series A rounds. |
| 3Note that the All Rounds metrics include flat rounds and, in certain cases, Series A financings as well. Consequently, metrics in the All Rounds column may be outside the ranges bounded by the Up Rounds and Down Rounds columns, which will not include such transactions. |
| |
Bridge Loans
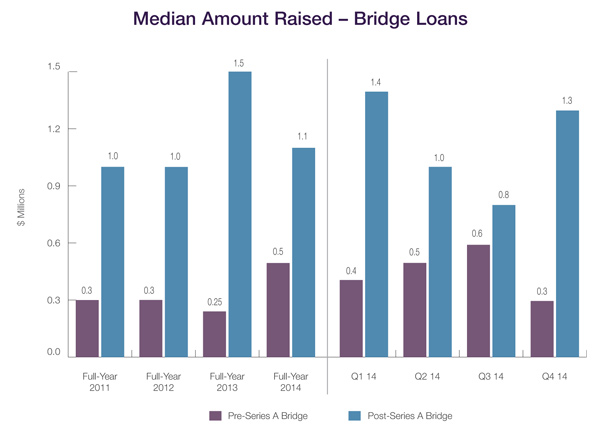 The median amount raised in pre-Series A bridge loans doubled from 2013 to 2014, rising from $0.25 million to $0.50 million. In contrast, the median for later-stage deals declined, dropping from $1.5 million for post-Series A bridges in 2013 to $1.1 million in 2014. Results for Q4 2014 were also mixed, but went against the trend for the year. The pre-Series A median declined from $0.6 million in Q3 to $0.3 million in Q4, while the post-Series A median rose from $0.8 million in Q3 to $1.3 million in Q4. The median amount raised in pre-Series A bridge loans doubled from 2013 to 2014, rising from $0.25 million to $0.50 million. In contrast, the median for later-stage deals declined, dropping from $1.5 million for post-Series A bridges in 2013 to $1.1 million in 2014. Results for Q4 2014 were also mixed, but went against the trend for the year. The pre-Series A median declined from $0.6 million in Q3 to $0.3 million in Q4, while the post-Series A median rose from $0.8 million in Q3 to $1.3 million in Q4.
Bridge loans continue to be provided to pre-Series A companies with debt terms—interest rates, maturities, and subordination—that are more favorable than those offered to later-stage companies. However, with respect to features touching on equity interests—conversions and price caps—it is the later-stage companies that have the advantage.
Interest Rates. 72% of pre-Series A bridge loans that closed in 2014 carried interest rates below 8%, compared to only 64% of such loans that closed in 2012. Post-Series A loans continued to bear higher interest rates, as only 43% of such loans in 2014 had rates below 8%.
 Maturities. Pre-Series A loans continued to have longer maturities than post-Series A loans in 2014, with 71% having a maturity greater than 12 months. In comparison, only 37% of post-Series A loans had a maturity of that duration. Maturities. Pre-Series A loans continued to have longer maturities than post-Series A loans in 2014, with 71% having a maturity greater than 12 months. In comparison, only 37% of post-Series A loans had a maturity of that duration.
Subordinated Debt. Only 22% of pre-Series A loans had subordination provisions in 2014, as opposed to 48% of post-Series A loans.
Warrants. Only 5% of pre-Series A loans in 2014 carried warrants, compared to 19% of post-Series A loans.
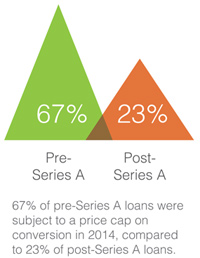
Conversion. Earlier-stage loans typically provide investors with more favorable conversion provisions to compensate them for the higher risk, and the 2014 data bore out this trend. Specifically, 81% of pre-Series A loans were convertible into equity at a discounted price, versus only 73% of post-Series A loans. Similarly, 67% of pre-Series A loans were subject to a price cap on conversion in 2014, compared to only 23% of post-Series A loans. Finally, the discount on conversion was 20% or higher in 89% of pre-Series A loans, but only 76% of post-Series A loans. .
Trends in Bridge Loans
Bridge Loans1 |
2012
Pre-Series
A |
2013
Pre-Series
A |
2014
Pre-Series
A |
2012
Post-Series
A |
2013
Post-Series
A |
2014
Post-Series
A |
Interest rate less than 8% |
64% |
70% |
72% |
44% |
46% |
43% |
Interest rate at 8% |
30% |
29% |
22% |
41% |
34% |
42% |
Interest rate greater than 8% |
5% |
1% |
6% |
15% |
20% |
15% |
Maturity less than 12 months |
8% |
3% |
12% |
34% |
29% |
24% |
Maturity at 12 months |
30% |
19% |
16% |
36% |
38% |
39% |
Maturity more than 12 months |
62% |
78% |
71% |
30% |
33% |
37% |
Debt is subordinated to other debt |
13% |
25% |
22% |
39% |
56% |
48% |
Loan includes warrants2 |
8% |
4% |
5% |
32% |
34% |
19% |
Warrant coverage less than 25% |
20% |
0% |
20% |
42% |
50% |
69% |
Warrant coverage at 25% |
40% |
0% |
0% |
33% |
12% |
0% |
Warrant coverage greater than 25% |
20% |
100% |
80% |
14% |
38% |
31% |
Warrant coverage described as variable or "other" |
20% |
0% |
0% |
12% |
0% |
0% |
Principal is convertible into equity3 |
99% |
100% |
98% |
97% |
94% |
94% |
Conversion rate subject to price cap |
65% |
68% |
67% |
24% |
14% |
23% |
Conversion to equity at discounted price4 |
79% |
91% |
81% |
52% |
59% |
73% |
Discount on conversion less than 20% |
17% |
17% |
10% |
15% |
16% |
25% |
Discount on conversion at 20% |
54% |
60% |
72% |
46% |
46% |
44% |
Discount on conversion greater than 20% |
29% |
22% |
17% |
39% |
38% |
32% |
Conversion to equity at same price as other investors |
12% |
9% |
16% |
38% |
35% |
24% |
1We based this analysis on deals having an initial closing in the period to ensure that the data clearly reflects current trends. Please note that the numbers do not always add up to 100% due to rounding.
2Of the 2013 pre-Series A bridges that had warrants, 33% also had a discount on conversion into equity. Of the 2013 post-Series A bridges with warrants, 24% also had a discount on conversion into equity. Of the 2014 post-Series A bridges with warrants, 38% also had a discount on conversion into equity.
3 This includes notes that provide for voluntary as well as automatic conversion.
4Ofthe 2013 pre-Series A bridges that had a discount on conversion into equity, 2% also had warrants. Of the 2013 post-Series A bridges that had a discount on conversion into equity, 15% also had warrants. Of the 2014 post-Series A bridges that had a discount on conversion into equity, 10% also had warrants.
|
WSGR Methodology
The Up/Down/Flat analysis is based on WSGR deals having an initial closing in the period reported to ensure that the data clearly reflects current trends. The median pre-money valuation is calculated based on the pre-money valuation given at the time of the initial closing of the round. If the issuer has a closing in a subsequent quarter, the original pre-money valuation is used in the calculation of the median for that quarter as well. A substantial percentage of deals have multiple closings that span fiscal quarters. The median amount raised is calculated based on the aggregate amount raised in the reported quarter. The numbers for each quarter of the year under discussion are regularly updated for additional internal deal reports submitted after each quarterly publication. Consequently, numbers and percentages for prior quarters reported in this issue may vary from those figures published for those quarters in previous publications.
[back to top]
Dow Jones VentureSource and PitchBook
Rank WSGR No. 1 for 2014 Venture Financings
Both Dow Jones VentureSource and PitchBook recently ranked Wilson Sonsini Goodrich & Rosati as the leading law firm for U.S. venture financings in 2014.
Dow Jones VentureSource's legal rankings for 2014 issuer-side venture financing deals ranked Wilson Sonsini Goodrich & Rosati ahead of all other firms by the total number of rounds of equity financing raised on behalf of clients. WSGR is credited as legal advisor in 249 rounds of financing, while its nearest competitor advised on 171 rounds of financing. According to VentureSource, WSGR ranked first for 2014 issuer-side U.S. deals in the following industries: business and financial services, clean technology, consumer goods, electronics and computer hardware, healthcare, industrial goods and materials, information technology, medical devices and equipment, semiconductors, and software.
Additionally, in PitchBook's 2015 Annual U.S. Venture Industry Report, the firm ranked first for combined issuer- and investor-side venture deals completed in Q4 2014. The firm also ranked first for early-stage deals in the fourth quarter. The rankings and the full report can be accessed at http://pitchbook.com/2015_Annual_U.S._Venture_Industry_Report.html.
|
For more information on the current venture capital climate, please contact any member of Wilson Sonsini Goodrich & Rosati's entrepreneurial services team. To learn more about WSGR's full suite of services for entrepreneurs and early-stage companies, please visit the Entrepreneurial Services section of wsgr.com.
For more information about this report or if you wish to be included on the email subscription list, please contact Eric Little. There is no subscription fee. |
This communication is provided as a service to our clients and friends and is for informational purposes only. It is not intended to create an attorney-client relationship or constitute an advertisement, a solicitation, or professional advice as to any particular situation..
© 2015 Wilson Sonsini Goodrich & Rosati, Professional
Corporation
Click here for a printable version of The Entrepreneurs Report |