|
From the WSGR Database: Financing Trends for Q1 2019
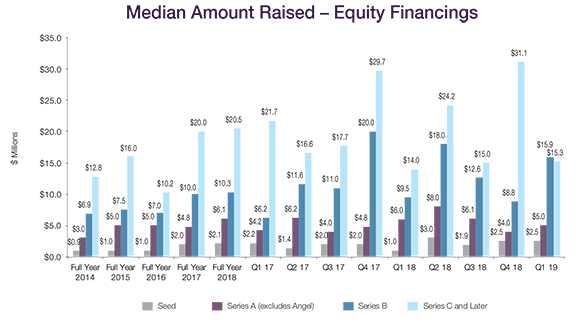
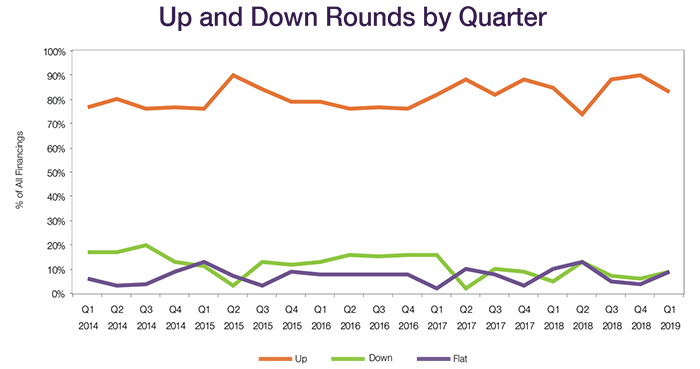
Coming off the record-breaking venture financing numbers of 2018, the first quarter of 2019 displayed some cooling off, in terms of pre-money valuations across all rounds and amounts raised in Series C and later rounds, although the market remained strong by historical standards. Q1 2019 had slightly fewer up rounds for Series B and later financings than did the last two quarters of 2018. Median pre-money valuations declined moderately across all equity rounds in Q1 2019. Median amounts raised remained strong for Seed, Series A, and Series B rounds, with those medians matching or exceeding those of Q4 2018. But the median amount raised in Series C and later rounds declined significantly, falling from the historic high of $31.1 million reached in Q4 2018 to $15.3 million in Q1 2019. Up and Down Rounds Up rounds represented 83% of Series B and later financings in Q1 2019, a decrease from the 90% share in Q4 2018, but in line with the 85% share in Q1 2018. Down rounds were somewhat more prevalent in Q1 2019, increasing to 9% of Series B and later financings from 6% in Q4 2018. The percentage of flat rounds also increased in Q1 2018 to 9% of financings, as compared to 4% in Q4 2018.
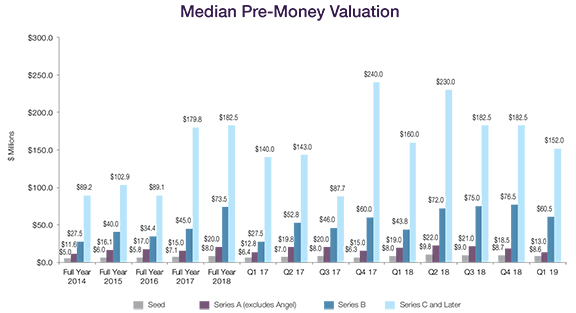
Valuations The median pre-money valuations for Series Seed financings was $8.6 million in Q1 2019, similar to $8.7 million in Q4 2018, while Series A valuations dipped from $18.5 million in Q4 2018 to $13.0 million in Q1 2019, a low not seen since Q1 2017. The median pre-money valuation for Series B rounds fell from a historic high of $76.5 million in Q4 2018 to $60.5 million in Q1 2019, but remained well above the five-year median of $44.5 million.
The Q1 2019 median pre-money valuation for Series C and later financings saw the largest decrease, falling to $152.0 million from $182.5 million in Q4 2018. Even so, it remained above the five-year median of $137.5 million for Series C and later rounds. Amounts Raised The median amount raised for Series Seed financings in Q1 2019 was $2.5 million, the same as in Q4 2018. The median amount raised for Series A financings ticked upward from $4.0 million in Q4 2018 to $5.0 million in Q1 2019, but did not reach the full-year 2018 median of $6.1 million. Series B rounds saw the largest increase in amounts raised, with the median amount raised increasing from $8.8 million in Q4 2018 to $15.9 million in Q1 2019. This figure was also significantly higher than the full-year 2018 median of $10.3 million. But the median amount raised in Series C and later financings plunged by nearly 50% from the median of the prior quarter, falling from a high of $31.1 million in Q4 2018 to $15.3 million in Q1 2019, though this amount still exceeded the medians of Q1 and Q3 2018, at $14.0 and $15.0 million, respectively.
Deal Terms - Preferred Senior liquidation preferences in Series B and later rounds were less common in Q1 2019, decreasing from 31% of all such rounds in 2018 to 22% in Q1 2019, the lowest percentage seen in the past five years. Pari passu liquidation preferences increased to 75% of Series B and later rounds in Q1 2019, up from 69% in 2018 and the highest percentage seen in the past five years. The percentage of financings having a liquidation preference with participation increased slightly in Q1 2019 to 18%, up from 12% of financings in 2018. Fewer financings provided dividends in Q1 2019 than in prior years, with 60% offering dividends, as compared to 68% of financings in 2018. The use of redemption rights increased from 9% in 2018 to 21% in Q1 2019—the highest of the last five years. Data on deal terms such as liquidation preferences, dividends, and others are set forth in the table below. To see how the terms tracked in the table can be used in the context of a financing, we encourage you to draft a term sheet using our automated Term Sheet Generator, which is available in the Start-Ups and Venture Capital section of the firms website at www.wsgr.com.
Private Company Financing Deal Terms (WSGR Deals)1
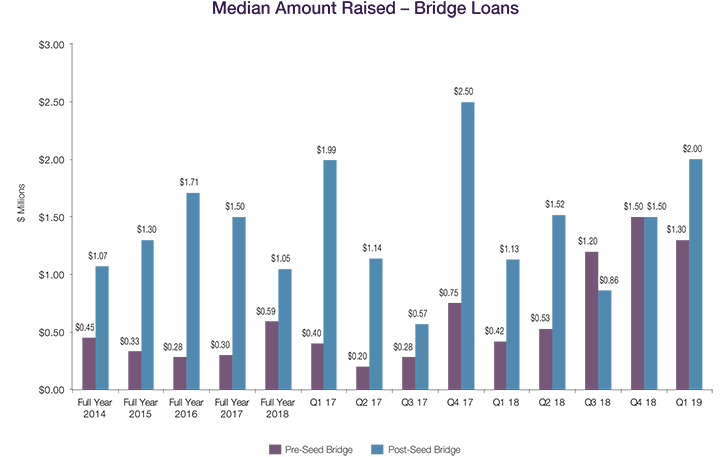
Bridge Loans The median amount raised for bridge loans grew for both pre- and post-Seed deals in Q1 2019. The median amount raised for pre-Seed bridge loans increased to $1.30 millionthe second highest quarterly median in the last five years. Post-Seed bridges also raised more dollars, with the median amount raised climbing to $2.00 million, higher than the Q4 2018 and full-year 2018 medians of $1.50 million and $1.05 million, respectively. Deal Terms – Bridge Loans Pre-Seed bridge loan interest rates rose in Q1 2019, with 38% of loans having interest rates of 8% or greatera moderate increase from 33% of such loans in 2018. On the other hand, post-Seed bridge loan interest rates declined in Q1 2019, with just 17% of such loans having an interest rate of 8% or greater, as compared to 35% of such loans in 2018. Maturity periods reflected a similar trend. Eighty-eight percent of pre-Seed bridge loans had maturity periods of 12 months or more in Q1 2019, up from 80% in 2018. The percentage of post-Seed bridge loans having maturity periods of 12 months or more declined to 34%, down from 79% in 2018. All Q1 bridge loans were convertible into equity at a discounted price, with all preSeed loans and 40% of post-Seed loans receiving a discount rate of 20% or more on conversion.
Bridge Loans Deal Terms (WSGR Deals)1
An Interview with Amit Bhatti of 500 Startups
Among other topics, Amit discussed 500 Startups mission, the global investment climate, qualities that make for successful entrepreneurs, and how 500 Startups programs help shape venture ecosystems around the world. How would you describe 500 Startups? Were on a search to find the best entrepreneurs across the globe, help them scale their businesses, and grow ecosystems in different communities worldwide. Its easy to get jaded with certain things in venture, but one of the many rewarding things about 500 is that it feels like thats a true mission. Our cohorts are consistently very diverse, as are 500s partners and employees. We find ourselves on the front lines of building ecosystems in locations where I never expected to see start-up communities. Tell us about your role. I spend a lot of time working directly with our portfolio companies, helping them with their structure, equity issues, and legal issues, and advising on fundraising. Internally, I have a different set of responsibilities working primarily with our legacy portfolio, which has grown immensely. Part of my job is making sure that once companies leave our programs, we still provide support and community. I also spend a good portion of my time training our associates to become the next generation of the firm. No two days are alike, which keeps things interesting. The latest numbers on 500s website show 2,200+ portfolio companies, 74 countries, and 3,000+ founders. Whats the global venture community environment like? Our experience confirms what most would expect: global access to venture capital is increasing and theres more interest in venture from all sources. For example, as in the U.S., there are many family offices and corporations, which werent previously a major direct part of venture. They might have been introduced to venture as an LP in funds and have naturally started taking the next steps to make direct investments. Wherever we go, especially in newer ecosystems—whether its Latin America, the Middle East, or Southeast Asia—theres always a big interest in direct investing from family offices, other types of investment funds, and even governments. Are certain non-U.S. regions particularly active? Its hard to pick just one, especially given 500s mission. Asia has been very active. In the region, 500 has people in China, Vietnam, Korea, Thailand, Singapore, Malaysia, and Indonesia, and all of them are finding great deal flow, so we see the portfolio growing in a big way. Were also seeing a lot of deal flow coming from Latin America, where our team in Mexico just unveiled their 10th accelerator cohort after reviewing almost 1,500 potential companies across all of Latin America. And deal flow in the Middle East is strong; we just ran both a seed accelerator and another program for Series A companies in the region. In some regions, theres substantial interest from governments and sovereign funds to reshape their economies and theyre placing emphasis on technology start-ups, so that can create greater deal activity globally. One stat we feel really validates 500s mission and shows how global VC has become is that in the last year, we saw the number of $1 billion companies in our portfolio jump into the double digits, and more than half are now based outside the U.S. The tricky part with non-U.S. markets is that there are not always participants at every level of the ecosystem. In Silicon Valley, for example, you have angel and Series A investors, growth equity investors, venture banks, acquirers—you have to have participants in all levels of the ecosystem for venture to really work. Elsewhere, some regions are becoming more active in angel investing and seed-stage investing, but there are gaps in the other parts of the ecosystem, so companies can easily get stuck without options unless they expand more globally or look to other markets. Because we have a global network, we help companies by bridging those gaps. Its a challenge, especially in regions where things are just getting started. What industries are the most active, and which do you think will have sustained growth? Fintech is an area that seems active across the board, from seed to late stage. It helps that you have corporations like Visa, Barclays, Fidelity, and other large institutions investing in the next wave of their industry. You also see lots of fintech activity worldwide. Our last accelerator cohort included a fintech company from Africa that generated significant investor interest. So, it feels like fintech is a sector thats hot regardless of geography or stage. Another sector thats active is AI and machine learning. A large percentage of applications to our accelerator programs mention these technologies, because theyre applicable to so many industries. I dont see that trend slowing anytime soon. Its a matter of finding the applications that actually work. Blockchain is a great example of how something can rise and fall. Eighteen months ago, blockchain was everywhere and pitches included all kinds of integrations that seemed unnecessary. Now, you dont see blockchain mentioned as much. Even great companies that are based on blockchain dont mention it up front because they dont want the negative reaction of being associated with something over-hyped. But we and others still like investments in blockchain, because the basic infrastructure uses of the technology are still to come. What are some of the qualities youre looking for in an entrepreneur or founder? Every founder is different, and I think youd get many different answers even within our own team, but Ill list some qualities that seem to make for a successful entrepreneur. One is to be a problem solver who executes on those solutions. There are lots of smart founders, but some can get lost in over-optimizing, instead of seeing a challenge, addressing it, and moving on. Thats especially true with early-stage start-ups. If you get overly locked into one issue, youll never move forward. A second quality is coachability. Its great when you see a founder who clearly has the advantage of being a leader in their space, but its even more impressive when they might be the best at something, but they know their limitations and are willing to accept help in other areas. Thats when its easier for us to see that persons potential to combine what they know well with what others know, and apply that knowledge toward building a company and team. Another quality is to be excellent at time management. Typically, at the early start-up stage, founders are everything to the business, so they have to be able to prioritize between time spent on product development, customer development, sales/marketing, hiring, and fundraising. You mentioned you have a new class of companies that started with 500 recently. Are you seeing certain characteristics in them? I cant mention specifics yet, but we just started with 36 new companies. We looked at over 2,000 applications or pitches to get to that number, so we feel this is an impressive group. About 30 percent of the applications we received were from companies with a female founder. That tracks around the numbers of our portfolio generally, where more than a quarter of the companies weve invested in have a female founder. Obviously, we always want to see diversity figures improving. The funnel of applications were seeing still arent where wed like in this respect, but theyre moving in the right direction. Another interesting characteristic about the new class is that its more varied in terms of the current stage of each company. Because were industry agnostic and take companies in different industry verticals and with different business models, weve seen that companies have completely different drivers and often need different amounts of time at the seed stage before seeing the results and scale that will enable them to fundraise. As a result, weve broadened our search criteria to acknowledge that companies in certain industries may not be able to pitch at a demo day after three months; they might be at an idea stage versus already getting traction. If we didnt allow for that flexibility, we might miss those companies as seed-stage investors. This is a reflection of how we often think about 500 as a start-up, and not just an investor in other start-ups. This is the 25th cohort of companies in San Francisco and each one is slightly different, because were always iterating on what works best to help our companies and drive returns for the fund. What are the biggest challenges companies are facing? Capital funding, talent, access to other resources, sharpening their ideas? All are challenges, and depending on the stage, a company could be facing all of them simultaneously. Most founders will say fundraising is always an issue. Every start-up could do with more funding, especially in developing markets where access to capital can be more difficult. Companies also often struggle with product/market fit at early stages. Even if theyve identified a great solution, there may not be an obvious market for it. Statistics show one of the main reasons a company doesnt succeed is because theres no alignment between the technology and the right market, or the market simply doesnt exist. Are there aspects of programs like 500s VC Unlocked that are becoming more important? The programs evolve depending on what were seeing in the market. For example, our recent program in Paris focused on corporate innovation because large companies are increasingly interested in getting involved in the start-up and tech economy. Programs also focus on key topics like the use of convertible securities, which is what we use primarily for early-stage investments. Those can be tricky documents for founders and investors because the amount of dilution or ownership investors are going to take is not always immediately apparent. Later-stage investors dont like that, and founders dont like how much equity has gone away. We focus on convertible securities so early-stage investors can be more knowledgeable and educate their portfolio companies. The VC Unlocked programs start with fundamentals of how to do early-stage investing. Weve found there is a wide range of sophistication in the different ecosystems we enter. When we talk about early-stage investing in Silicon Valley, we have certain accepted norms for documents and processes, most people know the name of the game, and it helps transactions go smoothly for companies and investors. The programs help make sure that, as we enter new markets around the world, everybody has the same information. This creates a healthier ecosystem that ultimately benefits our own companies and investments. Do business practices outside the U.S. and Silicon Valley make that difficult? In addition to different business customs or cultural norms, there may be different corporate and securities laws. But, you can usually work your way toward a document that looks like a convertible security with a discount and valuation cap—its just that those discounts and valuation caps might be higher or lower depending on the region. We try to get everybody in sync because a lack of understanding can present major issues for both investors and companies. Investors might end up disappointed with timeline to liquidity or the lack of control they might have—or think they should have—at the seed stage. Companies end up disappointed with investment timing or because the founder has to spend too much time dealing with an investor versus building the business. We focus our programs on ensuring expectations are more realistic, so the overall health of the ecosystem grows. Could you tell us more about 500s corporate innovation program? Our corporate innovation programs aim to help corporates work more effectively with start-ups and we partner with them in a variety of ways to do this. For example, weve been working with GM for several years to help them find start-ups to successfully run pilots with. Were also helping Air Asia with direct, early-stage investment, consulting with them on the start of their own corporate VC fund; theyre very interested in the start-up economy and want to stay ahead of the technology curve. Weve found each corporate partner we work with has slightly different objectives and we try to adjust for that. Were excited about partnering opportunities because, as we discussed, an ecosystem needs different players in order to function. Efforts like VC Unlocked are all about investing our time educating other investors. Thats good for us because, if were investing in a company in a region that doesnt have many investors, and we just trained 30 more who eventually are able to co-invest or invest downstream from us, that makes the ecosystem healthier. Its the same situation with our corporate innovation program because our efforts add participants to ecosystems, and those companies eventually consider acquiring start-ups, funding them, advising them, or developing talent in them that the companies can leverage in the future. What does the future of 500 Startups hold? More global is always a priority for us. The challenge is to look at global growth in terms of a VC fund horizon, which is usually 10 or so years. Our team is global by nature—half are non-U.S. Half of our portfolio is also non-U.S., so our team is always traveling to new places. As we do, we cant help but wonder, what if we did something here? But its difficult to know if that location is one where a fund with a 10-year horizon would generate returns or exits. At our core, were a venture capital firm; we still need to produce returns for LPs. So, were constantly evaluating and talking with interesting GPs or others who might be the right partner to launch a fund with in a new country. Its important that were always improving—just as we expect our companies to do—and continuing to experiment, ensuring programming is directly relevant to founders and making the venture community stronger. Fortunately, because of our scale, we have the means to keep everyone connected as a community and weve got a lot of ideas and initiatives coming together that will make the community even tighter and more connected in ways that benefit all participants. Tech Start-Ups Mostly Maintain Structuring Status Quo After 2017 Federal Tax Reform By Emily L. Foster This article, written by Emily L. Foster, is based on a Practising Law Institute webcast presentation on April 23, 2019, by Myra A. Sutanto Shen, a partner in the Palo Alto office of Wilson Sonsini Goodrich & Rosati. The article originally appeared in Tax Notes, published by Tax Analysts, on April 29, 2019, pp. 774-775, titled, Tech Start-Ups Mostly Maintain Structuring Status Quo Post-TCJA. Republished with permission. Most of the new ventures and emerging growth companies that considered different entity types and locations because of the Tax Cuts and Jobs Act (TCJA) have chosen to maintain their current structures, according to one practitioner. Faced with decisions on the appropriate business structure and whether to form an entity in the United States, the vast majority of startups are still forming corporations, said Myra A. Sutanto Shen of Wilson Sonsini Goodrich & Rosati during a Practising Law Institute webcast on April 23. For high-tech companies—including those in the biotech and pharma sector—the preference for C corporations over partnerships increased after the TCJAs enactment, Shen said. Shen pointed out that before the TCJA, venture capital investors favored C corporations over partnerships in part because they didnt have to worry about effectively connected income for their foreign limited partners or unrelated business taxable income for their taxexempt partners. Therefore, many earlystage partnerships and limited liability companies converted to C corporations to secure venture capital financing. Start-ups have also flocked to C corporations because of the favorable rules that allow companies to deduct costs for many years for various equity incentive compensation programs that are pervasive in Silicon Valley, Shen said. Companies in the high-tech world follow the herd and everybody issues options, viewing them as valuable incentives for their employees, despite the potential tax benefits of profits interests, Shen noted. Although employee incentives in partnership profits interests are more tax efficient—with the potential of being eligible for the capital gain rate on sale—start-ups resist issuing profits interests but are more comfortable issuing stock in C corporations, according to Shen. Thats because profits interest holders or partners in a partnership receive Schedules K-1 and generally cant be Form W-2 employees, which creates complexities particularly for the rank and file, Shen explained. She also noted that companies in the high-tech world follow the herd and everybody issues options, viewing them as valuable incentives for their employees, despite the potential tax benefits of profits interests. Thus, the TCJAs lowering of the corporate tax rate mostly increased startup preferences for the corporate form, Shen said. SALT Plus For the few start-up companies modeling tax costs in high-tax states like California, the limitation on state and local tax deductions for individuals yields a meaningful difference in the overall effective tax rate, Shen said. Corporations now enjoy the lower 21 percent corporate tax rate along with full SALT deductibility, while S corporation shareholders, partners, and sole proprietors are subject to a $10,000 cap on the deduction. Shen pointed to other incentives for operating start-ups as a C corporation—including the benefits of section 1202 qualified small business stock and the ability to reinvest cash in future operations and defer taxes that are at a lower rate. Under section 1202, noncorporate shareholders may—up to $10 million or 10 times the basis of the stock—generally exclude 100 percent of the gain from a sale or exchange of qualified small business stock that was acquired at original issue and held for more than five years if myriad statutory requirements are met. However, for start-ups expecting to distribute profits and that are eligible for the section 199A deduction, the resulting lower effective tax rate becomes a real incentive not to incorporate, Shen said. The passthrough deduction was added to the TCJA to provide parity with the corporate income tax cut and allows owners to take a 20 percent deduction on qualified business income up to specific income thresholds. Above the thresholds, some businesses are barred from using it, and the ones that can use it are limited by wages paid to employees and unadjusted basis in property immediately after acquisition. Home or Abroad? Before the TCJA, U.S. investors generally favored the relatively inexpensive and streamlined process of forming a domestic startup company and they understood whats required of Delaware corporations. Only startups with sophisticated founders or those seeking capital from non-U.S. investor bases, such as China, have been willing to undertake the cost and complexity of forming a non-U.S. company, Shen said. Also, the TCJAs lower corporate rate and complex issues concerning controlled foreign corporations and passive foreign investment companies have further reduced incentives to incorporate offshore. For example, according to Shen, the changes in the downward attribution rules in determining constructive ownership of a foreign corporation could cause global intangible low-taxed income, subpart F, and possibly PFIC tax consequences from the mere creation of a U.S. subsidiary of a foreign parent. In its transition tax provision, the TCJA repealed section 958(b)(4), which had provided that downward attribution wasnt to be applied so that a U.S. person would be regarded as owning stock owned by a non-U.S. person. That change created a stir among practitioners, given its potential reach in creating new CFCs. Under section 951A, each U.S. shareholder of a CFC is subject to tax on GILTI, defined as the excess of its pro rata share of tested CFC income over a 10 percent return (reduced by some interest expense incurred by CFCs) on its pro rata share of the depreciable tangible property of each CFC (qualified business asset investment). Waning IP Migrations The TCJA offered incentives for businesses to keep intellectual property in the United States, leaving fewer technology companies interested in pursuing the offshoring process. Along with the lower corporate tax rate, Congress introduced foreign-derived intangible income rules that allow a 37.5 percent deduction for a U.S. corporations deemed intangible income earned from the sale of property or services for foreign use, resulting in an effective tax rate of 13.125 percent for qualifying income. With those incentives, start-ups and other tech companies have been discussing whether to bring IP back to the United States because of the complexity of maintaining an IP offshore holding company. If the IP holding company isnt generating significant tax benefits, theres a lot of interest in minimizing the complexity that it creates, Shen said. Shen added, however, that most startups her firm has worked with havent actually brought IP back onshore primarily because of the cost of unwinding the existing structures. Shen described an example in which a U.S. company owns a Swiss company with the beneficial ownership of the IP split between the parent and the subsidiary. Although the Swiss companys distribution of IP to the U.S. company might not be subject to U.S. tax as a dividend under the TCJAs repatriation rules, its likely subject to Swiss tax on the appreciation of the IP since the structure was created, Shen said. If the distribution triggers tax in Switzerland, that gain could be subject to the GILTI tax, adding complexity to bringing the IP back to the United States and causing the companies to leave their structures in place, Shen said. If the distribution triggers tax in Switzerland, that gain could be subject to the GILTI tax, adding complexity to bringing the IP back to the United States and causing the companies to leave their structures in place, Shen said. However, she said she observed that some clients that originally incorporated in a hightax non-U.S. jurisdiction—Germany and Japan—and then flipped into the U.S. to get financing are considering moving all their IP into the United States or splitting the beneficial ownership between the U.S. and another tax-friendly jurisdiction. But some motivations to offshore IP continue. Companies with significant pre-2018 net operating losses could use those losses to offset 100 percent of their income, Shen said. Uncertainties concerning the viability of FDII and future corporate tax rates are among other factors that could also influence IP offshore migration. Although most companies havent touted those incentives that could influence IP structure decisions, its possible that well see more companies explore the possibility of moving IP offshore as the likelihood of corporate tax rate changes increases, Shen said.
WSGR Methodology
This report is based on detailed deal data provided by the firm's corporate and securities attorneys and analyzed by the firm's Knowledge Management department.
This communication is provided as a service to our clients and friends and is for informational purposes only. It is not intended to create an attorney-client relationship or constitute an advertisement, a solicitation, or professional advice as to any particular situation. © 2019 Wilson Sonsini Goodrich & Rosati, Professional Corporation Click here for a printable version of The Entrepreneurs Report |
||||||||||||||||||||||||||||||||||||||||||||||||||||||||||||||||||||||||||||||||||||||||||||||||||||||||||||||||||||||||||||||||||||||||||||||||||||||||||||||||||||||||||||||||||||||||||||||||||||||||||||||||||||||||||||||||||||||||||||||||||||||||||||||||||||||||||||||||||||||||||||||||||||||||||||||||||||||||||||||||||||||||||||||||||||||||||||||||||||||||||||||||||||||||||||||||||||||||||||||||||||||||||||||||||||||||||||||||||||||||||||||||||||||||||||||||||||||||||||||||||||||||||||||||||||||||||||||||||||||||||||||||||||||||||||||||||||||||||||||||||||||||||||||||||||||||||||||||||||||||||||||||||||||||||||||||||||||||||||||||||||||||||||||||||||||||||||||||||||||||||||||||||||||||||||||||||||||||||||||||||||||||||||||||||||||||||||||||||||||||||||||||||||||||||||||||||||||||||||||||||||||||||||||||||||
 Wilson Sonsini Goodrich & Rosati recently interviewed Amit Bhatti, principal at 500 Startups, one of the worlds most active venture capital firms. Prior to joining 500 Startups, Amit was an attorney at WSGR, where he represented technology companies across all stages of their life cycle, from start-up to IPO, as well as VC funds in their investments.